Results
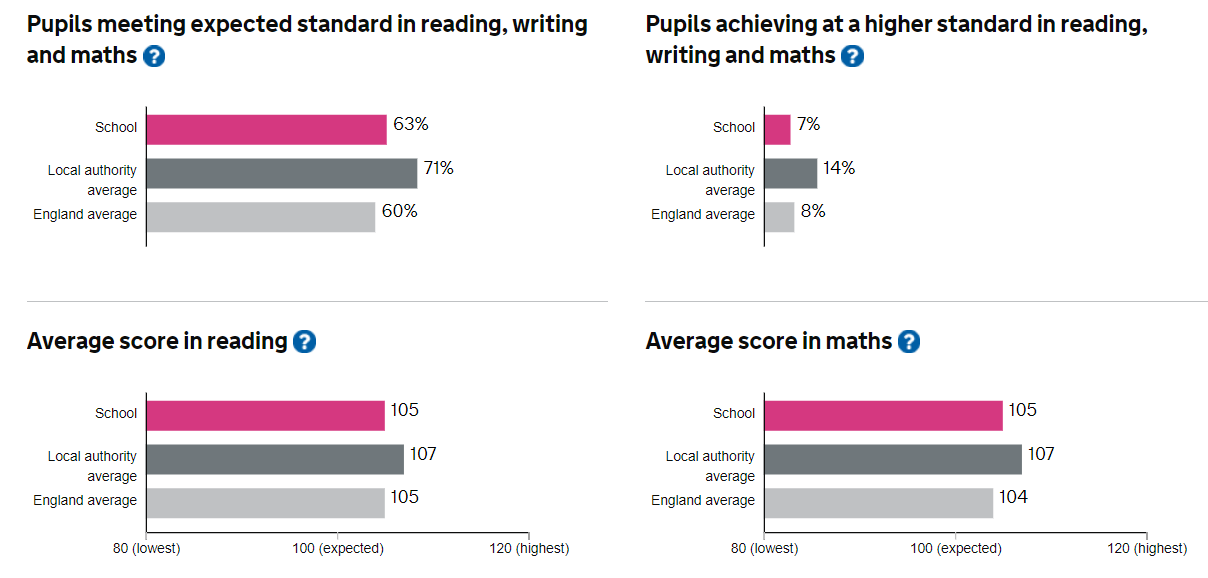
Please see the table below for a snapshot of our school performance.
Information in greater depth can be found on the 'Compare School Performance' website - Click here to open the comparison site.
EYFS
All |
Girls |
Boys |
Ever FSM |
Not Ever FSM |
|
Number of Children |
86 |
38 |
48 |
11 |
73 |
% of GLD Sheringham |
62 |
68 |
56 |
64 |
62 |
% of GLD Newham |
76 |
82 |
70 |
70 |
78 |
% GLD National |
KS1
School 2018 |
National 2018 |
School 2019 |
National 2019 |
|
Reading |
70 |
75 |
74 |
|
Writing |
65 |
70 |
68 |
|
Maths |
74 |
76 |
77 |
|
R+W+M |
62 |
65 |
64 |
|
Science |
71 |
83 |
75 |
Phonics
2016 |
2017 |
2018 |
2019 |
|
All - School |
76 |
85 |
86 |
92 |
All- National |
81 |
81 |
82 |
|
Boys - School |
71 |
83 |
79 |
88 |
Boys - National |
77 |
78 |
79 |
|
Girls - School |
81 |
88 |
93 |
96 |
Girls - National |
84 |
85 |
86 |
KS2 Results
Please note that the information linked below is for the 2018-19 academic year. Due to the impact of the COVID-19 Pandemic, the Department for Education has advised that schools continue to publish their 2018/19 data until further notice.
School 2018 |
National 2018 |
School 2019 |
National 2019 |
|
Reading |
71 |
75 |
71 |
73 |
Writing |
80 |
78 |
78 |
78 |
Maths |
81 |
76 |
86 |
79 |
R+W+M |
64 |
64 |
66 |
65 |
SPaG |
84 |
78 |
81 |
78 |
Please click here to see:
- School Dashboard - Click here to find a summary of our KS1 and KS2 results
- Department for Education Performance Tables - Find information about Sheringham's results and compare them to other schools